Efficiency Solutions
With our Voith "Efficiency Solutions" OnEfficiency, dataPARC cloud, OnView, we help you increase production, achieve the desired quality, and reduce costs at the same time - using visualizations, advanced-process controls, and AI-supported optimization tools.
Advanced process control
Voith's advanced process controls (APC) increase your profit by producing paper with the targeted quality - at the lowest cost and with the greatest efficiency.
OnEfficiency.BreakProtect
Description
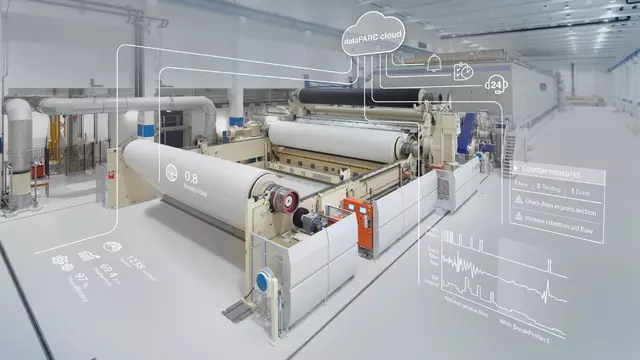
OnEfficiency.BreakProtect
OnEfficiency.BreakProtect uses a unique AI algorithm to automatically define break segments (breaks having the same break root causes). For each segment, a solution can be defined – ranging from counter actions applied each time the risk for this break segment increases to one-time optimizations and small rebuilds.
Benefits
Reduce paper breaks and increase production
- Automatic identification of break segments
- Sophisticated analysis tool to identify the cause of breaks and how to prevent them
- Warning of upcoming breaks including counter measures to prevent them
- Depending on initial situation, reduction of breaks by 25 to 50% and/or production increase of 1 to 2%

OnEfficiency.Strength
Description
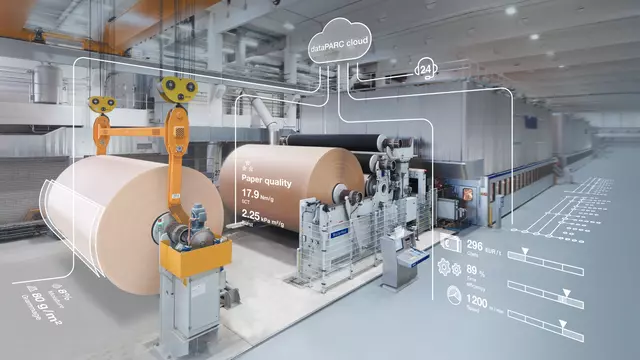
OnEfficiency.Strength
OnEfficiency.Strength combines three modules to create a new generation of advanced process control (APC): virtual sensors (also called soft sensors), model predictive control (MPC), and a cost optimizer.
The virtual sensors accurately predict quality values that otherwise are only available at the end of each tambour as the result of destructive tests in the lab. This allows the MPC to control the process to continuously reach these values, while the cost optimizer makes sure this happens at the lowest possible cost.
Benefits
Optimum paper quality at the lowest cost
- Stabilization and optimization of the production process
- Virtual sensors afford live availability of critical quality parameters, enabling closed-loop control
- Reduction of quality fluctuation and off-spec production
- Lower costs
Success Story 1

Improved and stabilized process
Field results Ružomberok PM18:
OnEfficiency.Strength lead to improved basis weight and ratio of fiber to ash.
2,800 tpy fiber savings in the first year, by ~ 0.5% basis weight reduction and ~ 0.3%-points ash increase.
Success Story 2

Easy integration, optimized results
Field results Fabriano PM3: On Efficiency.Strength lead to significant cost savings that have convinced the customer to use Voith’s digitization expertise for further machines as well.
Webinar Features

Free Live Webinar
We offered a webinar to inform you about the features of OnEfficiency.Strength. Did you miss part of the webinar or want to share it with colleagues? You can find the recording here:


OnEfficiency.DIP
Description

OnEfficiency.DIP optimizes an existing DIP line to create constant DIP quality at minimum cost. The existing flotation is supplemented by additional actuators; new sensors are installed to monitor the quality parameters.
The DIP quality fluctuations created by incoming raw materials or production changes are reduced by dynamic adjustment of the losses at the washing/flotation as well as real-time optimization of the bleaching chemicals dosage.
Benefits
Increased yields, lower operating costs
- Lower chemical and energy consumption
- Higher yields
- More consistent DIP quality
- Faster grade changes
Success Story 1

DIP line for newsprint with 170 ktpy
- yield increase from 77.9 to 79.8%
- energy consumption reduced from 35 to 32 kWh/t
- hydrosulfite charge reduced from 0.04 to 0.02%
- primary ash addition reduced from 28 to 16 kg/t
Total savings achieved: 1.22 MEUR/year, equaling a cost reduction of 13% or 7.2 EUR/t
Success Story 2

DIP line for newsprint with 350 ktpy
- yield increase from 85.7 to 88.1%
- energy consumption reduced from 42 to 27 kWh/t
- peroxide charge reduced from 0.99 to 0.78%
- hydrosulfite charge reduced from 0.12 to 0.06%
- primary ash addition reduced from 40 to 23 kg/t
Total savings achieved: 3.55 MEUR/year, equaling a cost reduction of 22% or 9 EUR/t


Advanced process visualization
Advanced-process visualization is the new way to visualize process data. Cloud-based applications running on dataPARC cloud provide intuitive user interfaces optimized for the different user groups in a paper mill.
dataPARC cloud.Suite
Description

dataPARC cloud.Suite
dataPARC cloud.Suite contains four apps: Analyzer, Cockpit, Events and Functions.
Analyzer is used to monitor and evaluate historical and live data, e.g. to find the root cause for a problem.
Cockpit visualizes the current status of the process in a clear and easily understandable way.
Events allows to displays and filter different types of events, e.g. for quick trouble shooting.
Functions allows customers to calculate new values based on existing data. The calculated values are then available for all other applications running on dataPARC cloud.
BENEFITS
Data, analysis, and visualization at one glance
- Intuitive web-based tools to easily gather, visualize, and intepret operational data
- Highly customizable visualization tools to generate useful insights specific to your operation
- Interconnected apps for maximum data consistency
- Actionable information to quickly isolate possible production issues and take appropriate measures


OnView.VirtualSensorBuilder
Description

OnView.VirtualSensorBuilder
OnView.VirtualSensorBuilder lets you create virtual sensors (soft sensors) quickly and without data analysis skills and display them either immediately via dataPARC cloud.Suite or in your own visualization tool.
BENEFITS
Create soft sensors quickly and without data analysis skills
- Fast creation of virtual sensors (soft sensors) - without data analysis skills
- Reduction of off-spec production through real-time availability of strength values
- Optimized paper quality at lower cost
- Faster grade changes


 charts provide details about the distribution of errors and which percentage of the virtual sensor predictions shows which magnitude of error.")
 for the virtual sensor prediction shows you which data is used to calculate the virtual sensor.<BR>While many of them might seem strange at first sight, a deeper analysis will often reveal the reasons, why the AI chose them as a good predictor for the specific lab value (vacuum setting are e.g. a good indication for dewatering properties of the fiber, which correlate with strength.)<BR>If you want to exclude specific data for building the model, you can do so when choosing the data sources during setup.")


WEBINAR

Free Live Webinar
We offered a webinar to inform you about the features of the OnView.VirtualSensorBuilder and cloud solution OnCumulus. Did you miss part of the webinar or want to share it with colleagues? You can find the recording and the shown presentation here:
OnView.MassBalance
Description

OnView.MassBalance
OnView.MassBalance allows the real-time visualization of all relevant losses. For each stream, the deviation from the standard operation range is visualized in an intuitive Sankey diagram. If losses rise above a warning threshold – which can be defined for each stream – the corresponding streams in the Sankey diagram will be marked and the operators will receive recommended countermeasures, which also can be individually defined.

Benefits
Visualize and reduce losses
- Easy troubleshooting/optimization through real-time visualization of losses
- Increased process transparency by making the stream deviations visible
- Loss reduction by defining countermeasures for each reject stream
Success Story

Reduction of fiber losses with help of OnView.MassBalance
The diagram shows the results from Saica Venizel, with an OCC line with 250 ktpy. Optimization based on the monitoring by OnView.MassBalance lead to ~ 2% fiber (paper for recycling / raw material) savings on average. A “reset” to the initial settings clearly showed the importance and positive effect of continuous monitoring and optimization.


OnView.Energy
OnView.Energy is a cloud application which can be connected to any data sources to show energy consumption over time, structured by process area, energy type (electricity, steam, gas) and displayed in kWh, CO2 equivalent or cost. Different views, filters and statistical analysis tools allow detecting deviations and optimization potentials.

Customer benefits
- Dashboards and intuitive analysis tools increase transparency and help to identify savings potentials
- Optional alarms and countermeasures support to reach optimum operation settings to reduce energy consumption, CO2 emissions and cost
- ISO 50001 compliant reporting supports in ISO 500001 certification
- Save effort & time with automatically generated and distributed reports